Debugging Made Easy with Pry
Introduction
In the vast realm of software development, debugging is an indispensable skill. Whether you're a novice programmer or a seasoned developer, encountering bugs in your code is inevitable. Thankfully, the Ruby community offers a powerful tool to aid in the debugging process: Pry.
Understanding Pry
What is Pry?
Pry is a runtime developer console for Ruby. It allows developers to interact with their Ruby programs during runtime, providing a powerful alternative to the standard IRB (Interactive Ruby) console. Pry offers features like syntax highlighting, code introspection, and debugging aids, making it an invaluable tool for debugging, exploration, and development.
Installation
Installing Pry is a breeze, thanks to RubyGems. Open your terminal and execute:
gem install pryOnce installed, Pry becomes available for use in your Ruby projects.
If you want to add Pry to your existing Rails project,
add the below line to your Gemfile
and
execute the bundle install command.
group :development, :test do
  gem 'pry'
end
Getting Started with Pry
Basic Usage
Using Pry is straightforward.
You can invoke it within your Ruby program by requiring the pry gem
and
calling the binding.pry method where you want to pause execution
and
enter the Pry console.
For example:
require 'pry'
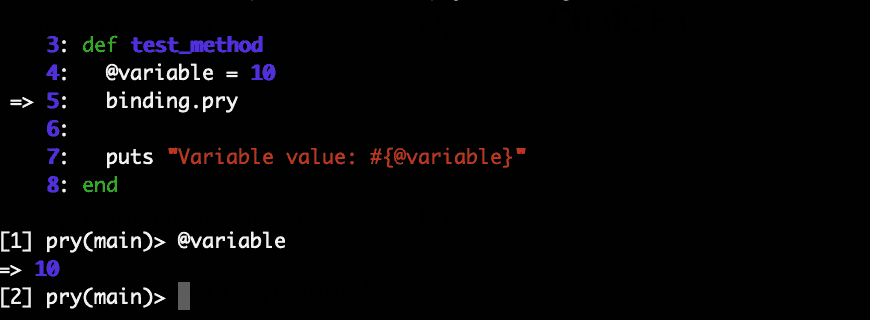
def test_method
@variable = 10
binding.pry
puts "Variable value: #{@variable}"
end
test_methodExecuting the above code will pause execution at the binding.pry line,
allowing you to interactively inspect variables
and
execute Ruby code within the context of your program.
The following screen will appear
if you save the above code in a file named test_pry.rb
and
execute ruby test_pry.rb.
In a Rails project,
debugging with pry makes it easy to identify potential issues with
your code.
You need to add binding.pry in your code
and
inspect functions' variable values
or
return values.
Let's say you have a UsersController
in your Rails application.
To create a new user,
you call the create action,
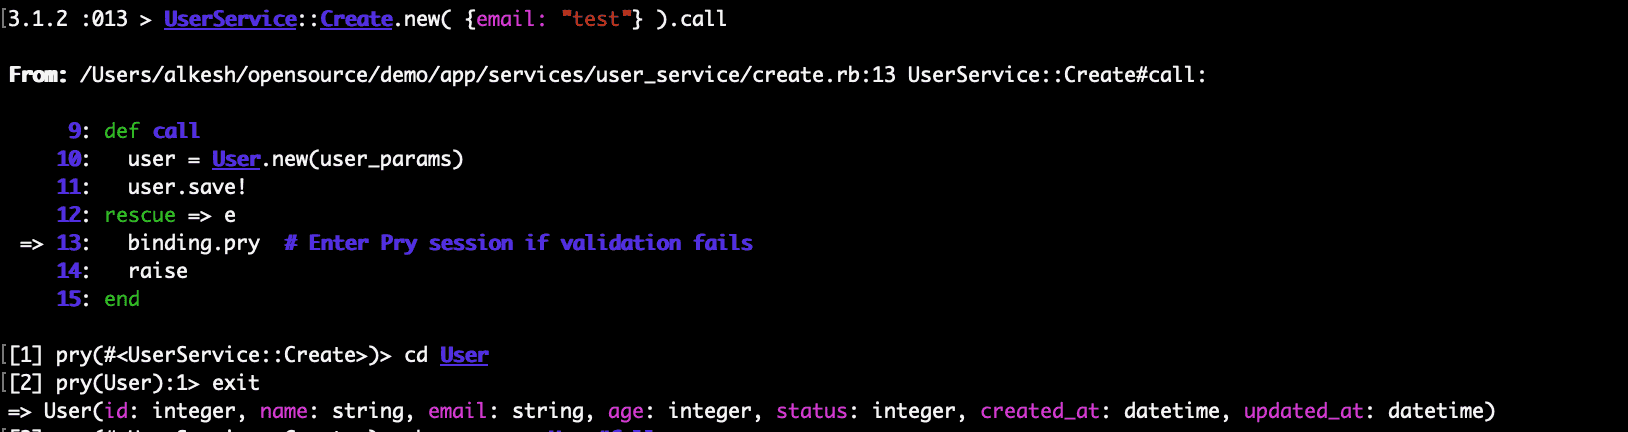
which calls a service class UserService::Create.
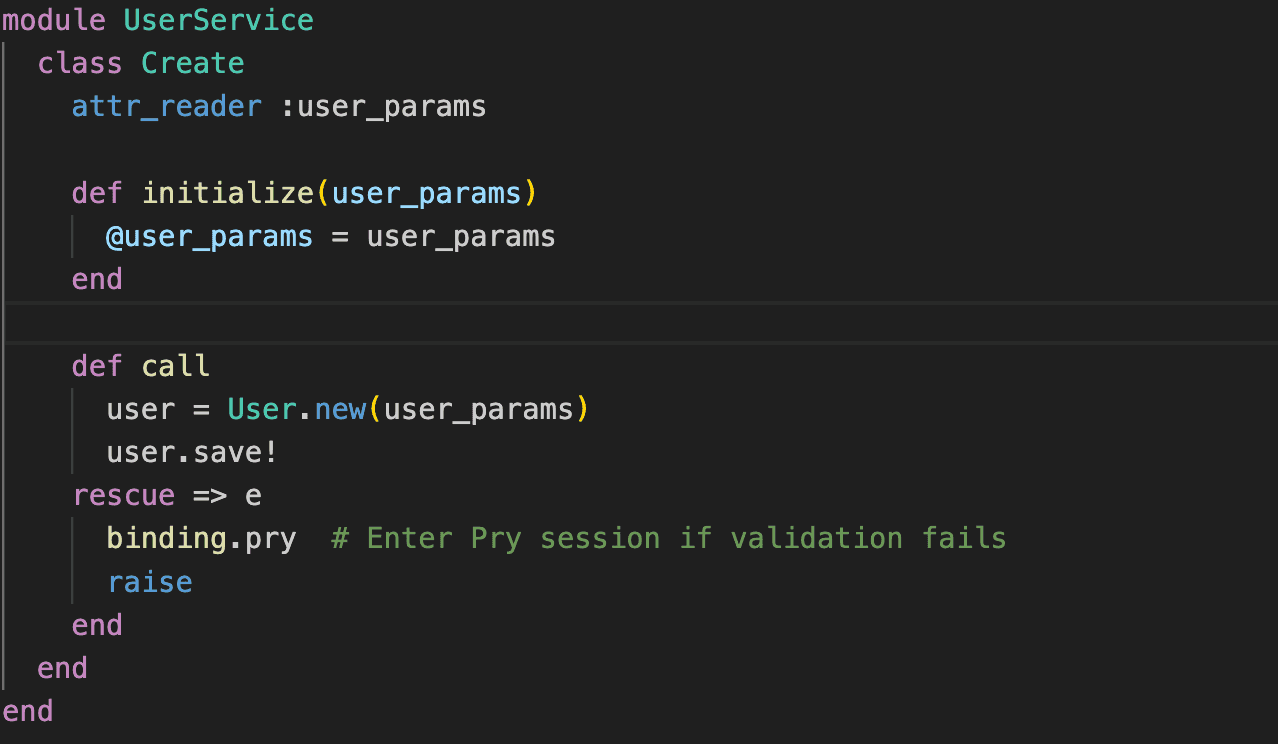
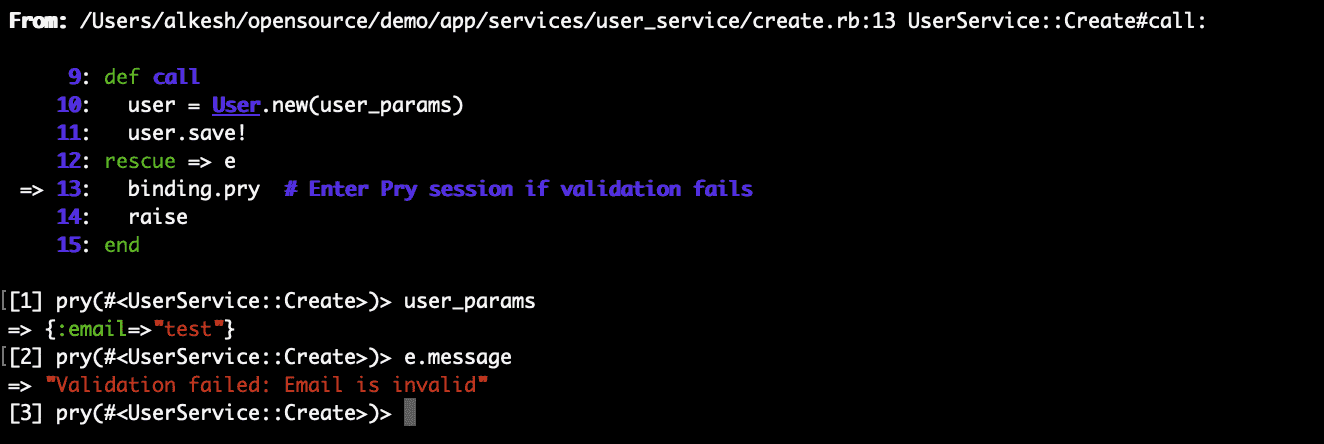
When you execute the service, the code gets stuck at the binding.pry line. You can verify the user parameters and the exceptions raised when creating a user.
Similarly, using Pry in test files can be immensely helpful for debugging and understanding the behaviour of your tests. Whether you're dealing with failing tests or unexpected results or just want to explore the test environment, Pry provides an interactive console that allows you to pause test execution and inspect variables, objects, and code.
Navigation
Once inside a Pry session,
you can navigate the call stack,
inspect variables,
and
explore your codebase.
Commands like ls,
cd,
and
show-source allow you to easily explore objects,
change contexts,
and
view method definitions.
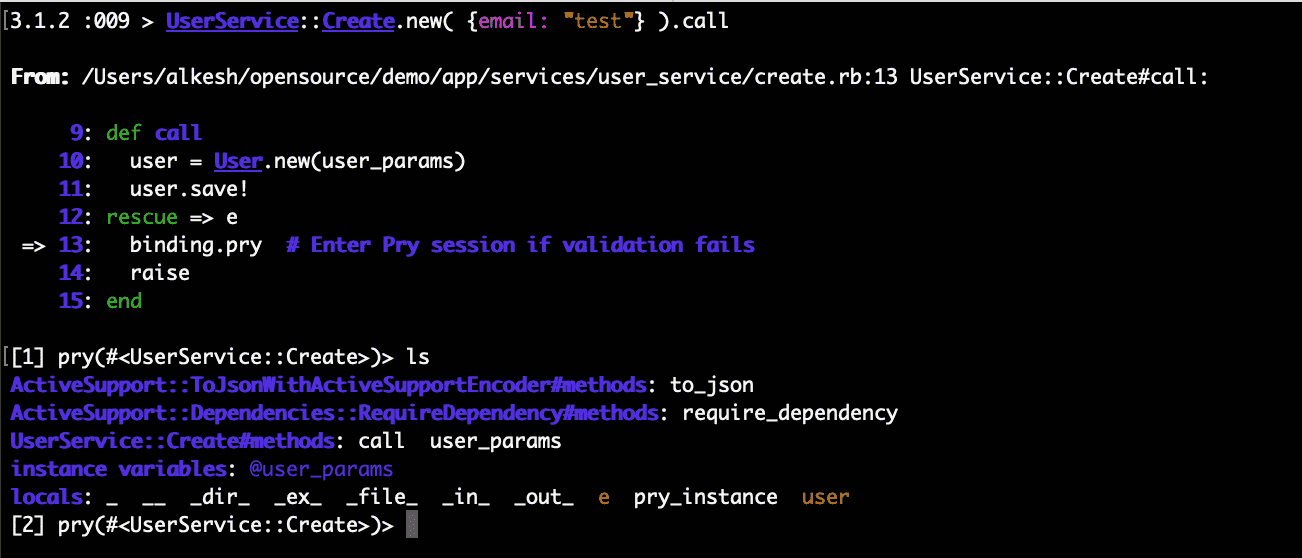 The
The ls command in the pry session.
Using the cd command,
you can navigate to the User class.
Advanced Features of Pry
Syntax Highlighting
Pry enhances code readability with syntax highlighting. This feature makes it easier to differentiate between keywords, literals, and method calls within your code, improving overall readability and comprehension.
Breakpoints
Pry allows you to set breakpoints within
your code using the binding.pry statement.
When execution reaches a breakpoint,
Pry pauses execution
and
provides a console for interactive debugging.
This feature is invaluable for identifying
and
fixing bugs in your code.
Watch Expressions
With Pry, you can monitor the value of specific expressions or variables using watch expressions. By setting watch expressions, you can track the value of variables as your program executes, helping you pinpoint the source of bugs more effectively.
Using watch expressions in Pry is straightforward.
Once you've paused execution at a breakpoint using binding.pry,
you can set watch expressions to monitor specific variables
or
expressions.
require 'pry'

def counter_method
  counter = 0
  loop do
    counter += 1
    puts "Counter: #{counter}"
    binding.pry if counter == 3
  end
end

counter_method
In this example,
we have a simple method counter_method that increments a counter in a loop.
We've set a breakpoint using binding.pry when the counter reaches 3.
Now,
let's use a watch expression to monitor the value of the counter:
[1] pry(main)> watch counterNow, as you continue execution, Pry will display the current value of the counter each time it changes:
Counter: 1
Counter: 2
Counter: 3

From: /path/to/file.rb @ line 7:

    2:   loop do
    3:     counter += 1
    4:     puts "Counter: #{counter}"
    5:     binding.pry if counter == 3
    6:   end
 => 7: end

[1] pry(main)> counter
=> 3
Conclusion
Pry is more than just a debugger for Ruby developers. With its interactive console, powerful debugging features, and extensibility, Pry empowers developers to write better code, debug confidently, and explore the depths of their Ruby applications. Mastering Pry will elevate your Ruby development workflow whether you're a novice programmer or a seasoned developer. Start exploring Pry today and unlock the full potential of your Ruby projects!


