An introduction to test suite optimization in Ruby
Preface
The Ruby on Rails community is well known for its attitude towards testing, and this is understandably seen as a very positive thing: most software engineers will probably agree that automated testing is a practical necessity for building robust, reliable, and maintainable applications, especially in a dynamic language like Ruby.
As an application grows though, so does the amount of tests required to cover all the functionality in a satisfactory manner. And as your test suite grows, so does its execution time - which means CI/CD takes longer, your costs go up and your developers are more prone to context-switching since they have to keep tabs on CI pipelines on their PRs. This is especially true with system tests which, although very effective at catching lots of types of bugs, can be flaky and slow when not written carefully.
However, it doesn't have to be that way! To prove it, we'll go over some ways to tackle reliability and performance issues in your average Ruby on Rails application's test suite in this blog post.
What are system tests?
If you've ever worked on a RoR application before, you're likely familiar with what the official documentation calls system tests - also known as feature specs, Capybara specs, E2E tests, or whatever else your team might call them.
Generally, these are tests that exercise one or more user flows in your application by interacting with it through the same interface that your end users will use - as opposed to a test that, for example, focuses on exercising an internal application API and asserting that its outputs are correct. In practice, this usually means running a full web browser and simulating mouse and keyboard input on the pages, then looking for some content on the DOM to assert that everything worked as expected.
System tests offer great bang for your buck: there's a whole ecosystem of very mature gems that make them easy to write, and they can give you lots of code coverage very quickly. On the other hand, they can be tricky to write well: if you have flaky and/or slow specs that make waiting for CI to pass an unpleasant experience, it's very likely that the culprit will be your system tests.
Fortunately, there are things you can do to make sure that your system tests don't cause more pain than they actually need to.
My tests are so slow!
After a codebase has grown enough over time, this is usually the number one complaint developers have about their CI/CD setup. Nobody dares run the test suite locally because who knows how long that'll take, and "waiting for CI to pass so we can merge" actually becomes a common blocker for other tasks that should theoretically be completely unrelated.
The "easy" fix: test parallelization
Hardware is comparatively cheap and engineering time is expensive, so a very good first option is throwing more hardware at the problem.
Although your test runner might have multiple CPU cores,
by default,
a Ruby on Rails application running Capybara specs will only make effective use of a single core,
so using a gem to parallelize test execution across CPU cores is often an effective initial step.
This can be done via gems like parallel_tests,
turbo_tests,
and flatware on older versions of Rails (or if you're using RSpec),
and as of version 6,
this is a built-in feature that can be enabled by editing test_helper.rb like this when using Minitest:
class ActiveSupport::TestCase
  parallelize(workers: :number_of_processors)
end
That does entail spinning up multiple databases for each core though, which can unveil bugs due to race conditions and other similar pitfalls, so while it is an effective measure, it may not be a painless drop-in fix. AppSignal has written a great blog post about some of the troubles you can run into while parallelizing your tests.
However, this approach can only take you so far. Spinning up a test runner will always cause some overhead, and the more of them you need for your CI pipelines, the more room you have for something to go wrong, and the more the overhead eats into your performance "boost". At some point, you'll need to look into actually optimizing your tests.
The "hard" fix: test optimization
If tests are slow on CI,
the developers on the team probably already have several hunches about what the causes are.
Maybe our factories are slowing us down because the models are too complex and there are too many relationships.
Maybe spec/rails_helper.rb is doing too much stuff during setup or teardown between tests.
Probably the worst thing you can do at this point is attempt to tackle those causes. Most of the time, unless we have a very intimate understanding of the framework(s) we're using and the hardware it's running on, our guesses about which pieces of code are causing performance bottlenecks are no more accurate than a coin flip.
Instead, the first step when attempting to optimize something should usually be to measure it. For this, we can use a profiler like StackProf. There are several different profilers for Ruby and the ideas here apply to any of them, but I'll be referencing this gem specifically for this blog post.
Generating and investigating flamegraphs
After installing StackProf, the first order of business is to collect raw profiles that we can use to generate flamegraphs later.
Profiling the entire test suite is usually neither feasible nor necessary: we can profile just a few specific tests which are representative of our "slow set", and that'll likely be enough to expose obvious performance bottlenecks if they exist.
We can do this by, for example, wrapping up our test executions like this:
# Somewhere in spec/spec_helper.rb
RSpec.configure do |config|
  config.around(:each) do |example|
    test_name = example.full_description.parameterize
    path = Rails.root.join("tmp/stackprof-#{test_name}.dump")

    StackProf.run(mode: :wall, raw: true, out: path.to_s) do
      example.run
    end
  end
end
This will create a separate profile for each test. Or we can bundle multiple tests up into one profile:
RSpec.configure do |config|
  config.before(:suite) do
    StackProf.start(mode: :wall, raw: true, out: 'tmp/stackprof-profile.dump')
  end

  config.after(:suite) do
    StackProf.stop
    StackProf.results
  end
end
Neither approach is objectively better than the other, but I prefer bundling up a few tests into the same profile. That way common patterns jump out to me more clearly, versus having to compare different profiles and spot patterns between them.
Either way, regardless of how you prefer to run StackProf, a couple of things are worth keeping in mind:
mode: :wallmeans that sampling will happen based on wall clock time, as opposed to the suggestedmode: :cpufrom the StackProf README which will sample based on CPU cycles.- This is important because, given the nature of system tests, which interact with several external components (database(s), a web browser, caches, external APIs), it's very likely that our performance bottleneck has nothing to do with CPU cycles spent within the Rails application.
- For example: when using
mode: :cpu, a long unoptimized database query will not show up in the collected profile because it's not taking CPU cycles within our codebase, since we're just waiting for a response from the database.
raw: truetells Stackprof to write out extra data, necessary for generating flamegraphs.
After collecting one or more profiles, you can then load them up into a flamegraph visualizer. There are many of these available, but a personal favorite of mine is Speedscope. It's a browser app that takes in JSON files, so we'll need to convert our files first:
stackprof tmp/stackprof-profile.dump --json > tmp/stackprof-profile.jsonAfter loading up a JSON file into Speedscope, you should be greeted by a flamegraph. By default, they look something like this:
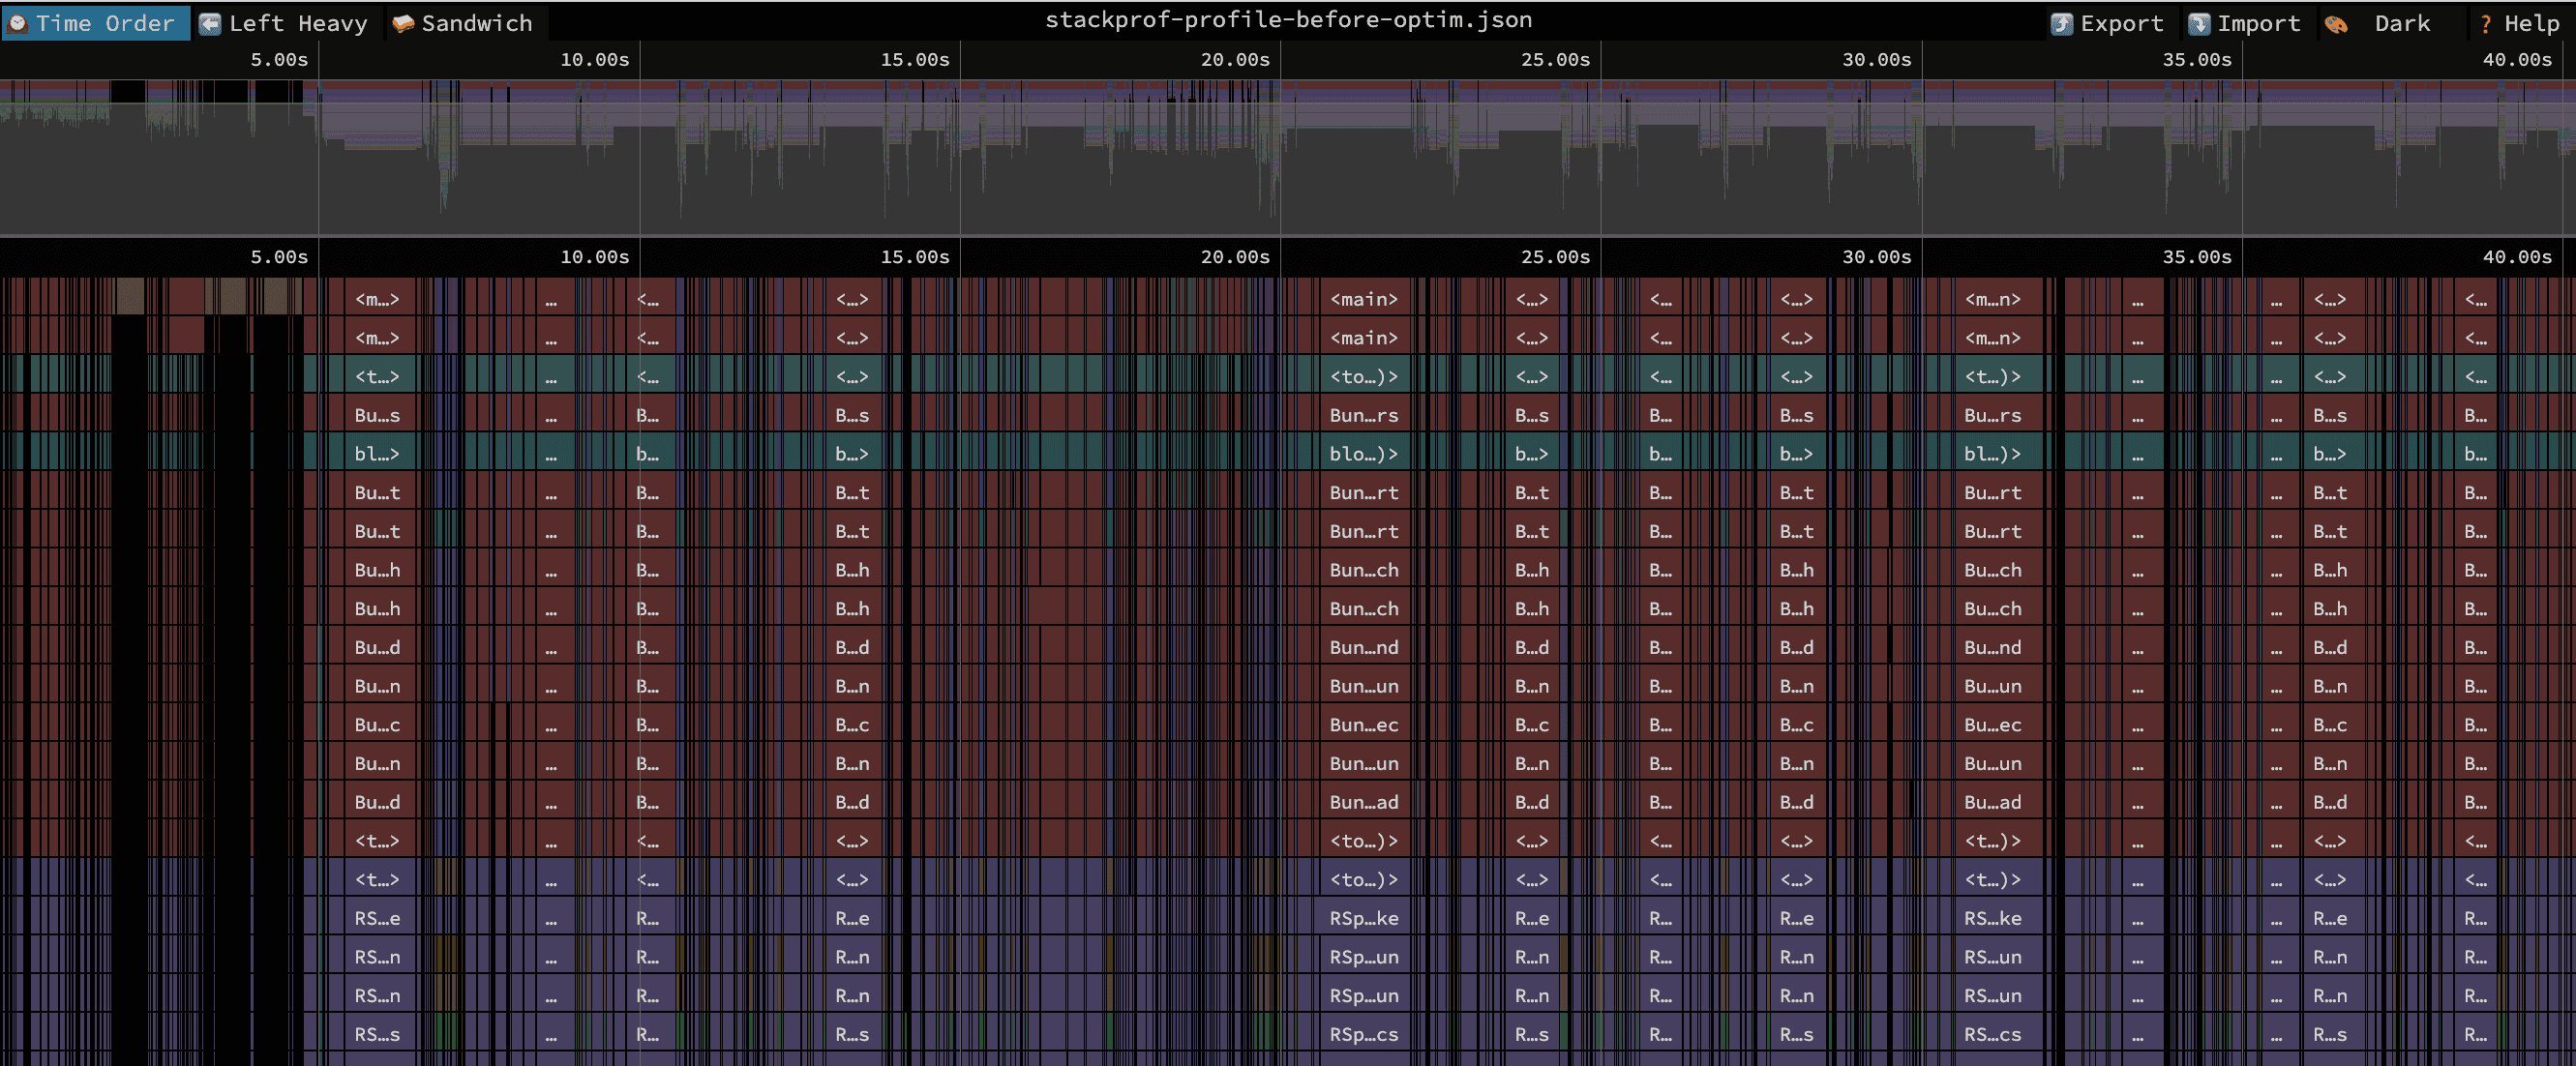
There are a few different ways to visualize the data, all of which are described in the documentation. If you're still feeling lost after reading through the documentation, Paweł Świątkowski has a great blog post where he goes through and debugs a StackProf profile using Speedscope in a real-world application, which should give you an idea of how to go about investigating your own profiles. We'll also briefly go over a concrete example below.
Common pitfalls
Unfortunately, every codebase is different and there's no perfect step-by-step guide you can follow to easily optimize it. However, when talking about Ruby on Rails applications specifically, there are usually a few things that show up pretty regularly, so let's talk about some of them in hopes they spark some ideas of things to be on the lookout for:
Excessive usage of sleep
You should not need to sleep anywhere in your tests.
If the test becomes flaky or fails outright when the calls to sleep are removed,
chances are:
- You need to write a helper to wait for the specific condition that the test depends on, instead of hoping that waiting for X seconds will always result in that condition being fulfilled; or
- A bad Capybara matcher is being used,
creating unnecessary flakiness that the
sleepcall is then countering. There's a great post in Gusto's engineering blog called "Eliminating Flaky Ruby Tests", and there's a section called "Dangerous Capybara Wait Matchers" there. It's a very useful read to learn about this problem specifically.
As an aside,
sometimes one does indeed run into some bizarre edge case where not even hours of investigation will elucidate what the cause of the flakiness is.
In a situation where you need to move fast,
throwing in a sleep there isn't the worst thing in the world,
but it should be done very sparingly.
Slow but commonly-used helpers
This one is a great issue to have because fixing it usually results in drastic speedups.
A concrete example: consider an application where most pages are hidden behind authentication. In other words, the majority of tests need to sign in as a user before the relevant part of the test can actually begin executing.
An obvious approach is to have a sign_in helper which does this.
It might navigate to the login page,
fill out the form,
submit it,
and wait for a redirect.
This sounds fine when taken at face value considering we're writing system tests,
where we want the test execution to resemble a user's journey through the application.
However,
the time spent doing this adds up very quickly across your test suite.
Instead,
the sign_in helper should ideally bypass this flow entirely by automatically setting a valid user cookie or something of the sort,
and the proper login flow should be tested as a separate spec.
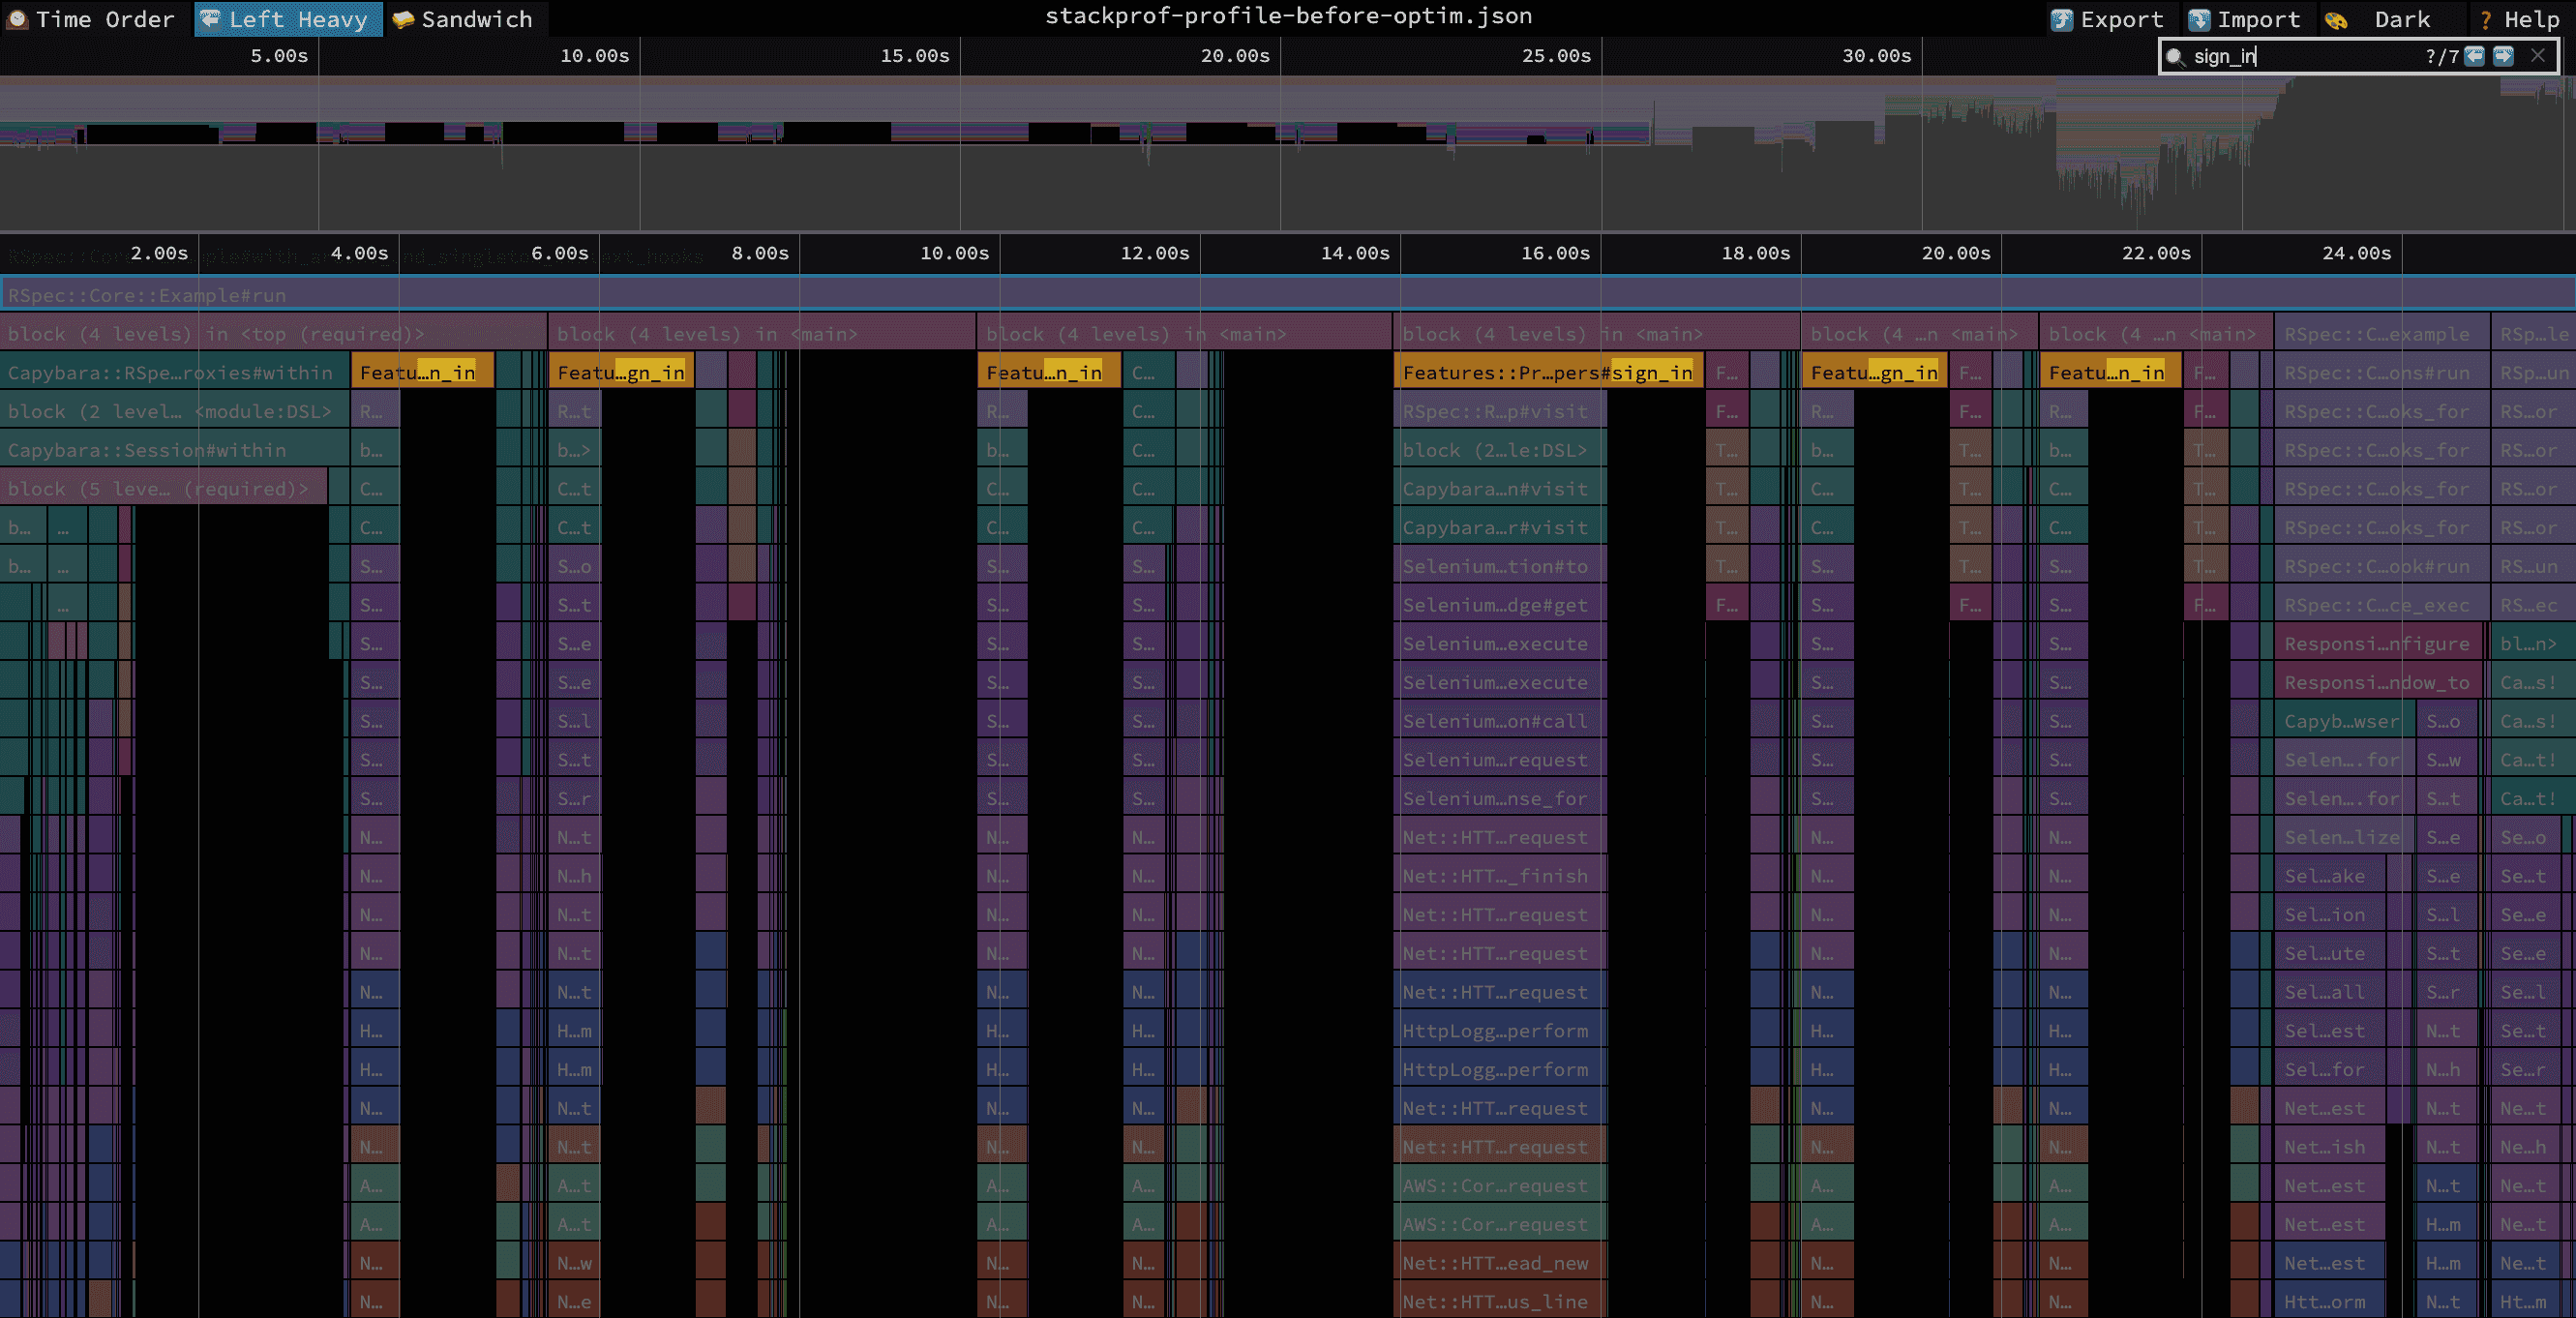
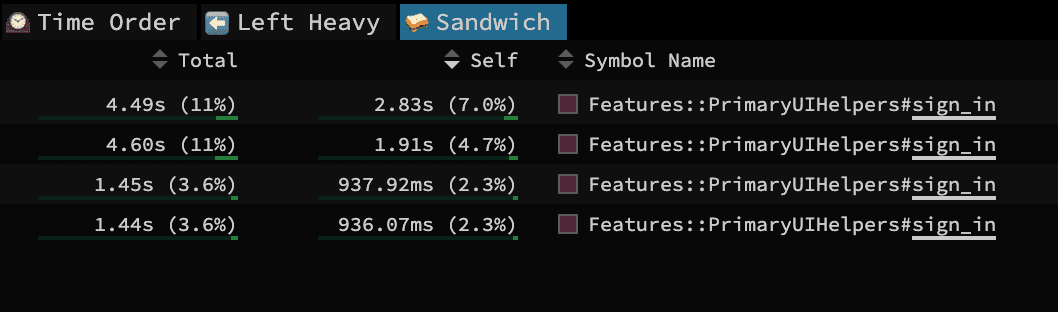
This pattern is usually pretty easy to spot when looking at a flamegraph that contains multiple test executions because there will be noticeable repetition across specs:
Applying the optimization described above, we went from spending ~12 seconds total signing in:
To ~2 seconds:
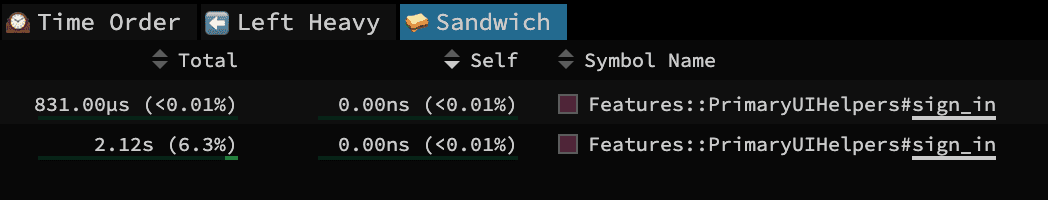
And that's just for a few specs! Across the entire test suite, this can shave off minutes or tens of minutes.
Animations
Not a lot to say about this one. Animations are great when you're actually using the application, but during tests, they slow things down unnecessarily. Thankfully, if you're using Capybara 3.2.0 or above, all you need to do is stick:
Capybara.disable_animation = trueInto rails_helper.rb.
Although usually not a big win,
it's still an easy win.
General CPU-bound work
If you're getting to this point, it's usually a sign that you've already optimized away most of the unnecessary bottlenecks, and now you're down to work that needs to be done. If that's the case, likely you're looking at things that are affecting not only your tests but also production performance.
In case there is a need to optimize general application performance, that's when you'd be looking into things like improving your cache hit rates, GC tuning, and so on, which are out of the scope of this post. For that kind of work, I recommend going through "The Complete Guide to Rails Performance" by Nate Berkopec, which covers these points and a lot more.
So there you have it! Hopefully, this post shed light on the usual pitfalls one runs into as a Rails application's test suite grows over time, while also providing some useful resources for tackling them.
Closing Remark


